v0.3.3 — Just launched: ClumsyLinkWatch is a free public download. Download now.

ClumsyLinkWatch

v0.3.3 · Windows · Free

Prove it wasn't your network.

ClumsyLinkWatch continuously probes your connection — adapter, gateway, ISP first hop, DNS, and a quorum of independent internet anchors — and classifies exactly where a failure happened. When your ISP says everything looks fine on their end, you hand them a report instead of an argument.

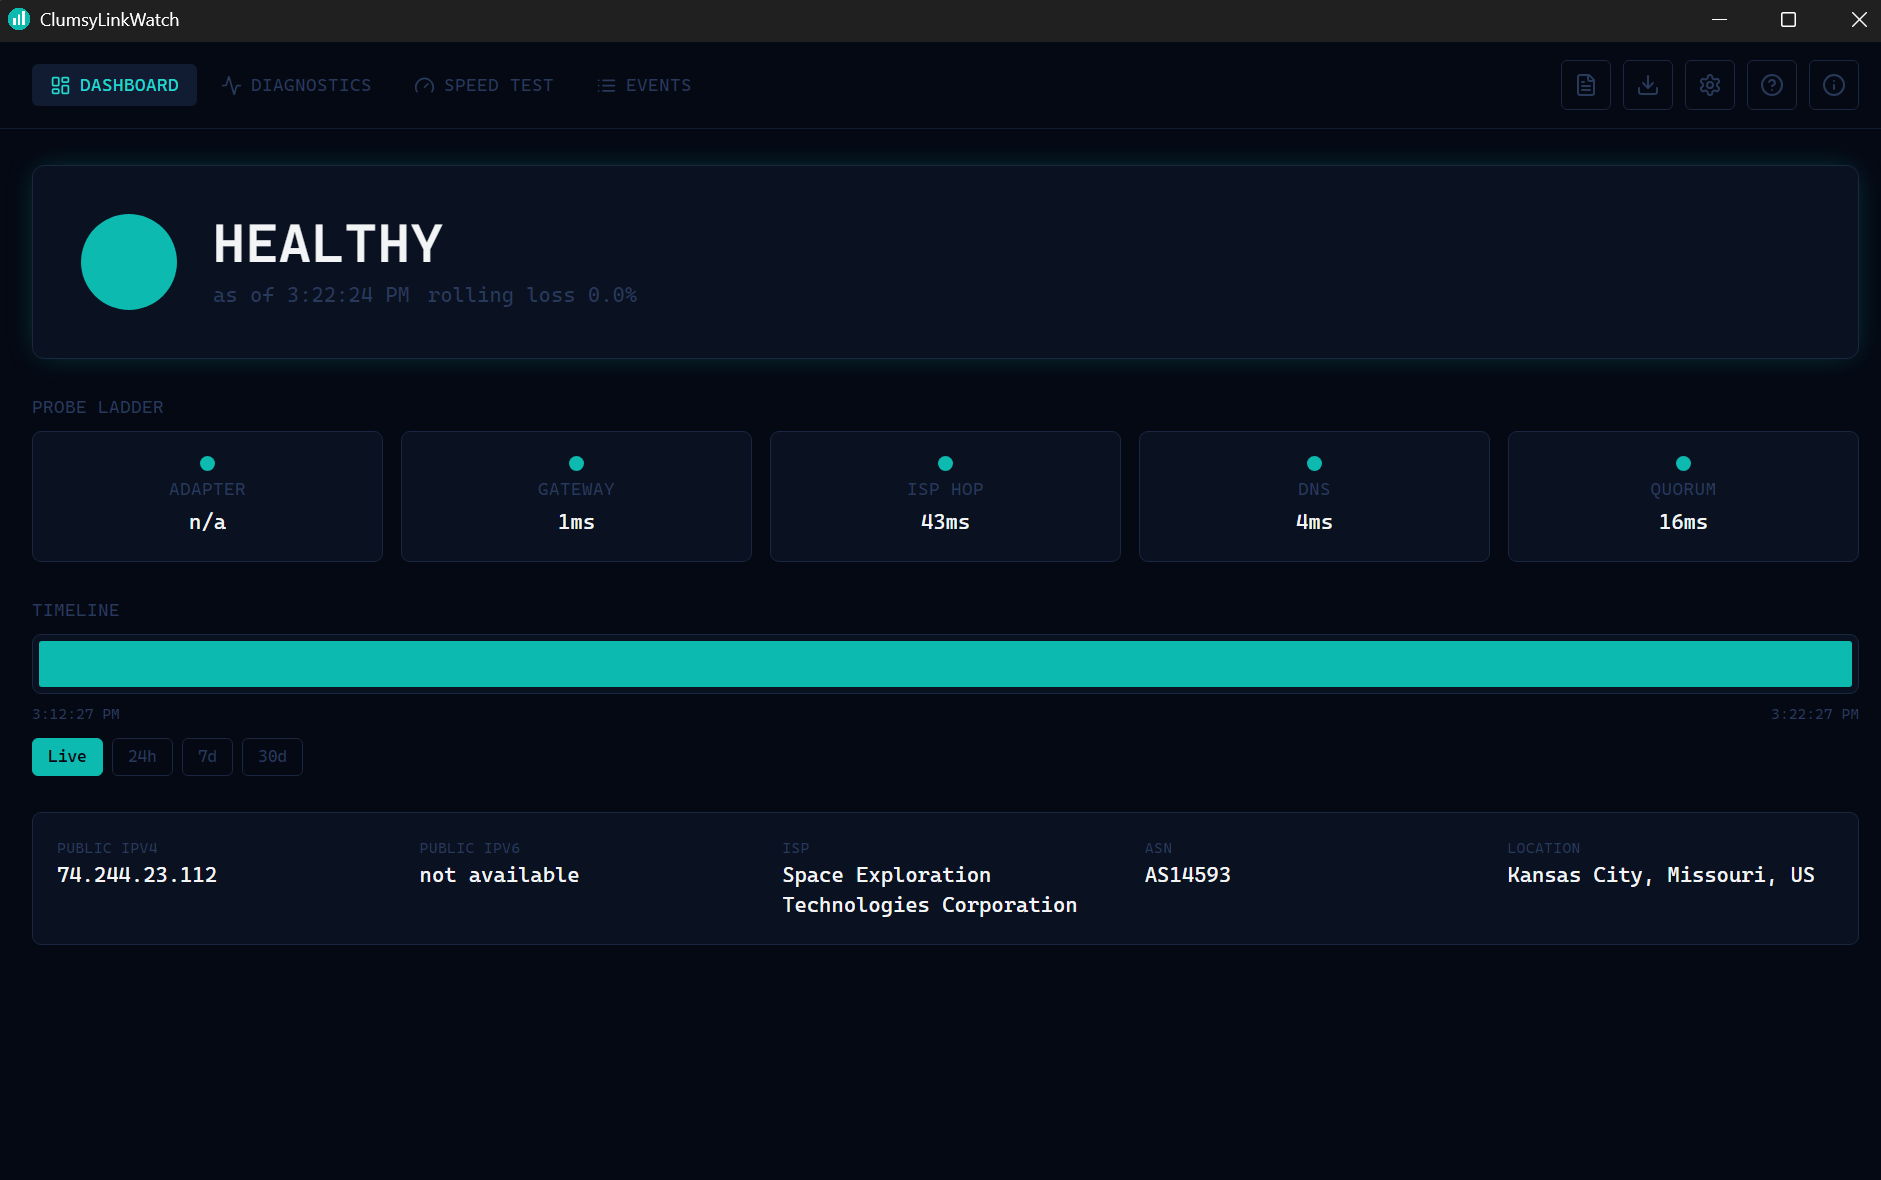
ClumsyLinkWatch live dashboard showing connection status, probe ladder, and timeline
ClumsyLinkWatch v0.3.3 Live status · probe ladder · timeline

Free for personal use · Windows 10/11 only

5-rung probe ladder ISP-fault classification HTML & PDF evidence reports Live timeline with history Discord/Slack webhook alerts Starlink & dual-WAN aware Scheduled speed tests & pattern detection

What it does

The customer says the internet is dropping. The ISP says everything looks fine on their end. ClumsyLinkWatch runs continuously in the background, and when the link goes down it doesn't just log "outage" — it works out whose fault it was and keeps the receipts.

Probe ladder
Five checks in order, cheapest and closest first: adapter, gateway, ISP first hop, DNS, and a quorum of 3+ independent internet anchors. Confirmation retries before anything is declared down — a single dropped packet, which ISPs routinely rate-limit, proves nothing.
Fault classification
Adapter/gateway faults are yours. Last-mile, DNS, and upstream faults are the ISP's. Degraded means up but unusable. Host sleep is never counted as downtime, ever — a laptop that sleeps for nine hours doesn't get reported as a nine-hour outage.
Evidence reports
Export HTML or PDF with a plain-English methodology paragraph, an ISP-attributable outage table, a day-by-day timeline, and an appendix listing every excluded event and why — nothing hidden, because hiding data looks worse than showing it.
Live dashboard
A status card that reads at a glance, per-rung latency, a real-time timeline strip with hover detail and Live/24h/7d/30d zoom, a 14-day latency trend chart, and the last full traceroute — every rung run every cycle for full evidence, not just wherever the ladder gave up.
Alerts that don't spam
Native desktop notifications and taskbar flashing for real faults — not for DEGRADED or sleep, which don't deserve the same urgency. Optional webhook alerts to Discord or Slack the moment something opens or closes.
Hardware aware
Detects a Starlink dish on the LAN, lists network adapters for dual-WAN setups, and checks for captive portals or DNS hijacking — the kind of interception that can make a broken connection look perfectly healthy.
Scheduled speed tests
Run automatically on a schedule you pick, with full history and a day/time heatmap that flags recurring slow windows on its own — the difference between "it feels slow sometimes" and "it's 40% slower every weeknight at 8pm."

Feature highlights

Probe ladder

Five checks in order, cheapest and closest first.

  • Adapter → gateway → ISP first hop → DNS → quorum
  • Confirmation retries before declaring a fault
  • Full traceroute run periodically for evidence
  • Every rung checked every cycle, not just until one fails

Fault classification

Knows whose fault it is, automatically.

  • LAST_MILE_DOWN, DNS_FAILURE, UPSTREAM_DOWN
  • ADAPTER_DOWN / GATEWAY_DOWN kept separate — your fault
  • DEGRADED — up but past a loss/latency threshold
  • HOST_SLEEP never counted as downtime

Evidence reports

The receipt your ISP can't wave away.

  • HTML & PDF export
  • Uptime %, "nines," and total outage time
  • ISP-attributable outage table
  • Appendix of excluded events — nothing hidden

Live dashboard

Reads at a glance, from across the room.

  • Timeline width proportional to real time, not per-poll
  • Hover any segment for exact time and duration
  • Live / 24h / 7d / 30d zoom
  • 14-day latency trend chart

Alerts

Know the moment it drops.

  • Native desktop notifications
  • Taskbar flash on real faults only
  • Discord/Slack-compatible webhook alerts
  • System tray status, color-coded live

Hardware aware

Built for real home networks, not a lab rack.

  • Starlink dish detection on the LAN
  • Network adapter visibility for dual-WAN setups
  • Captive portal / DNS hijack detection

Scheduled speed tests

Not just a one-off number — a real history.

  • Runs on your own schedule: 30 min to 24h, off by default
  • Full history, sortable by worst download/upload/latency
  • Day/hour heatmap flags recurring slow windows automatically
  • Never counted as a false outage against itself

Latest release

v0.3.3
2026-07-27
Feature Update
  • Remote status page: full app parity — the Remote LAN Status page (Settings → Enable Remote LAN Status) now shows everything the desktop app does, not just status/ladder/events: an ISP/WAN panel, the 14-day latency trend chart, and a full Speed Test section (latest result, day/hour pattern heatmap, recent run history).
  • Remote event detail popup — tap any event in the Remote Status page's Recent Events list to open the same evidence popup the desktop Event Detail view shows, from your phone.
  • Speed test reliability fix — the speed test previously required a single 100MB+ request to complete without a hitch or it aborted the entire run with a "gave up after 20 retries" error — failing disproportionately on exactly the slower, flakier connections this app exists to diagnose. Chunk sizes are now capped at 25MB and total transfer per run cut from over 1GB to roughly 200MB. A mid-test hiccup now keeps whatever numbers were already measured, and Speed Test History updates immediately after a run finishes.
  • Event detail view — click any event in the Events list to see the full evidence behind it: every probe-ladder rung, DNS resolver, and quorum anchor result, plus a plain-English "why" for DEGRADED, with a Copy Summary button to paste it into a ticket or message.
  • Actionable webhook alerts — Discord/Slack notifications now include the specific DEGRADED reason(s) instead of just the bare class name, plus a "What to do" suggestion once the event resolves.
  • Scheduled speed tests — run automatically every 30 min / 1h / 4h / 12h / 24h (off by default), with a live data-cost estimate and an option to skip while a fault is already active.
  • Speed test history & pattern detection — every run is saved, sortable by worst download/upload/latency, plus a day-of-week × hour-of-day heatmap that automatically flags recurring slow windows — the difference between "it feels slow sometimes" and "it's 40% slower every weeknight at 8pm."
  • Self-interference guard — a running speed test now suppresses DEGRADED classification, since a real speed test saturates the link enough to cause latency spikes that could otherwise falsely trigger against itself.
  • Multi-screen redesign — rebuilt around four screens (Dashboard, Diagnostics, Speed Test, Events) instead of one long scrolling page.
  • Why DEGRADED was triggered — every DEGRADED event now records exactly which rung, whether it was loss or latency, and the measured value against the threshold it crossed. Shown live on the status card while it's happening, in the event history, in evidence reports, and on the remote status page.
  • Remote LAN status page redesign — was just a bare classification and timestamp, now shows the full probe ladder with live per-rung latency, rolling loss, a captive-portal warning banner, and color-coded recent events, styled to match the app itself.
  • SLA credit dollar calculation — enter a monthly bill amount in the report generator and get a prorated credit figure for ISP-attributable downtime, not just a duration.
  • Per-rung baseline auto-tuning — gateway, ISP-hop, and DNS rungs now get their own DEGRADED baseline instead of only the quorum rung.
  • Settings window fix — the Settings window could silently fail to open if it was requested before the local database finished starting up, with no retry. It now retries until settings are actually ready.
  • Check for updates from About — a refresh button in the About screen checks for a new version on demand, with inline status and Download/Restart actions right there.
  • Speed test fix — the built-in speed test was reporting near-zero results for everyone; the renderer now loads over a registered app scheme instead of a raw local-file URL, which was silently breaking the browser APIs the speed test relies on for accurate bandwidth and latency measurement.
  • Probe ladder & classification — five-rung fault detection with confirmation retries and full-path traceroute evidence.
  • Evidence reports — HTML/PDF export with methodology, outage table, timeline, and appendix.
  • Live dashboard — time-proportional timeline, latency trend chart, speed test, hardware panel.
  • Alerts — native notifications, taskbar flash, Discord/Slack webhooks, system tray status.
  • Auto-update — built-in updater, no manual reinstalls for future releases.
Download →

Download and get started

ClumsyLinkWatch™ is a free download for personal use. It monitors your connection continuously, classifies faults by whose responsibility they are, and produces a report you can actually hand to your ISP. No nags, no expiry, no account required.

Download Free Join Discord  ·  Email support